April showers bring… polluted runoff? Unfortunately, this is the case in many parts of the United States. The results can be dangerous.
Waterways often see peak nitrate concentrations in the spring. Nitrate, a compound created when nitrogen-rich fertilizers, manure, and sewage move through the environment, has catastrophic effects on natural systems. Eutrophication, fish kills, and algal
blooms are some of the symptoms of nitrate pollution in surface waters. Nitrate can also be dangerous when we consume it in our drinking water: it can lead to medical conditions including blue baby syndrome, thyroid disease, and cancers.
In agricultural areas like the American Midwest, fertilizer is applied to fields in the spring and, in some areas, in the fall. The nitrogen in this fertilizer can then follow one of three paths: it can be taken up by crops, it can be lost to surface
runoff or groundwater percolation, or it can end up sequestered in the soil. The influx of nitrate delivered to streams in the spring comes from a combination of runoff and sequestration. Spring rains pick up nitrogen from newly applied fertilizer,
while also mobilizing nitrogen that has laid in wait in the soil. All of this gets carried off to nearby waterways, where it can wreak havoc as nitrate.
Data gathered by the Izaak Walton League’s Nitrate Watch volunteers allows us to visualize this spring influx of nitrate pollution. Equipped with their free nitrate test kits, Nitrate Watch volunteers measure nitrate concentrations in waterways
important to them and report their results to the Clean Water Hub database. Volunteers participating in Nitrate Watch and the League’s
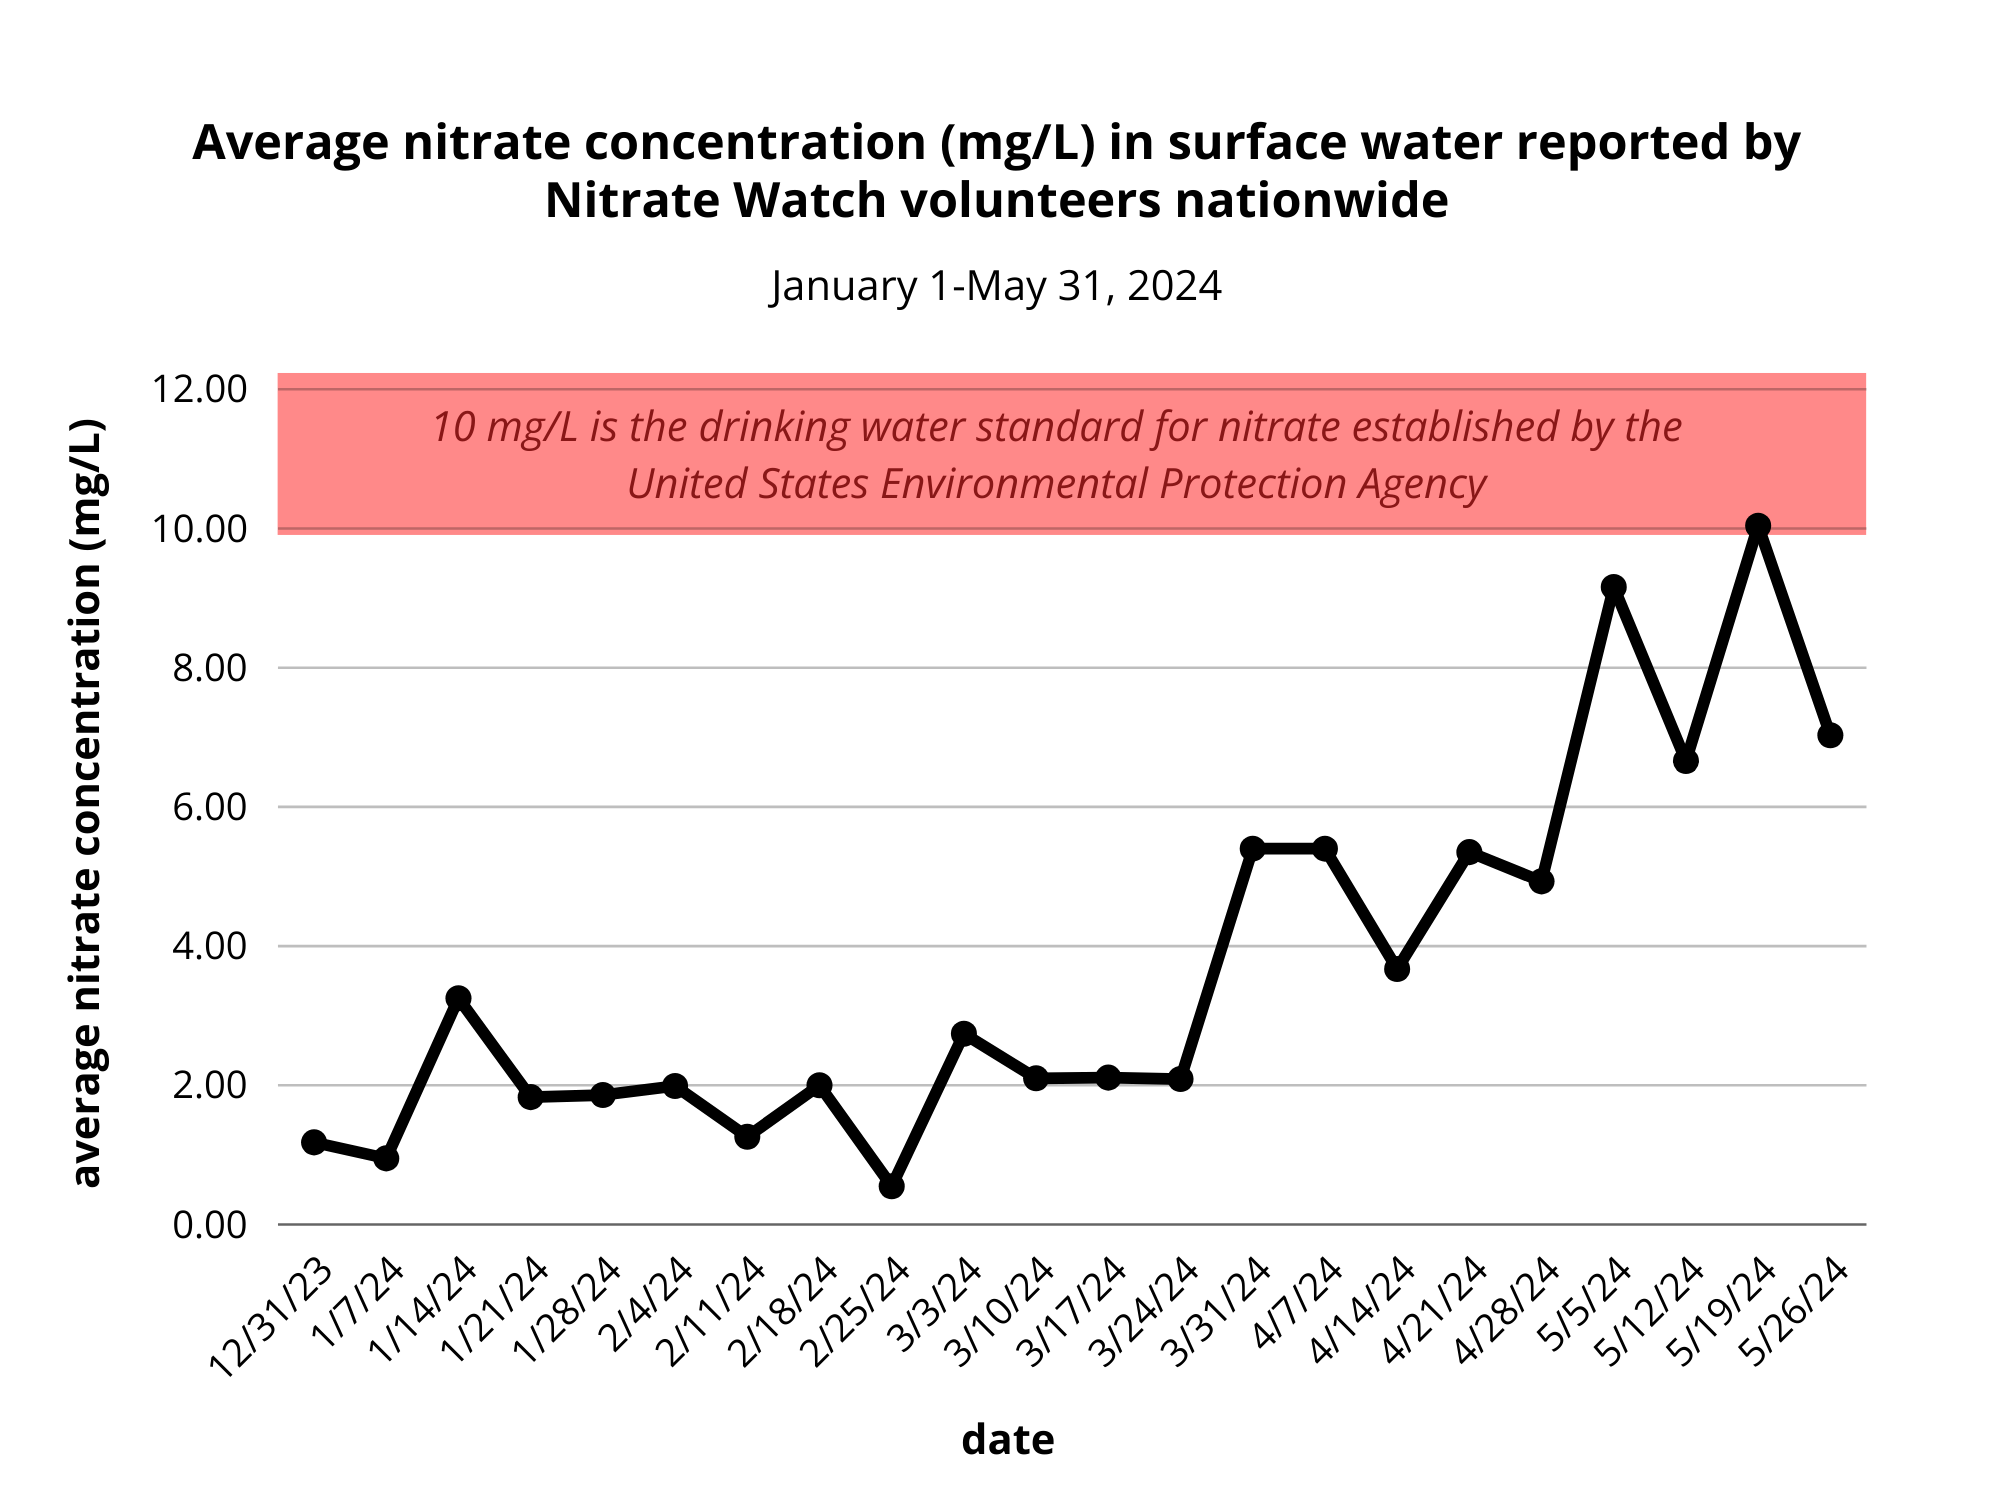
Save Our Streams chemical monitoring program reported over 1,200 nitrate readings between January and May of 2024 for surface waters (rivers, streams, lakes, wetlands, drainage ditches) across the nation. The following figure charts the weekly average
nitrate concentrations (mg/L) reported for surface waters nationwide.
Of the 1,225 surface water nitrate readings reported, 682 came from volunteers in Iowa. The following graph depicts nitrate concentrations (mg/L) reported for surface waters in Iowa.
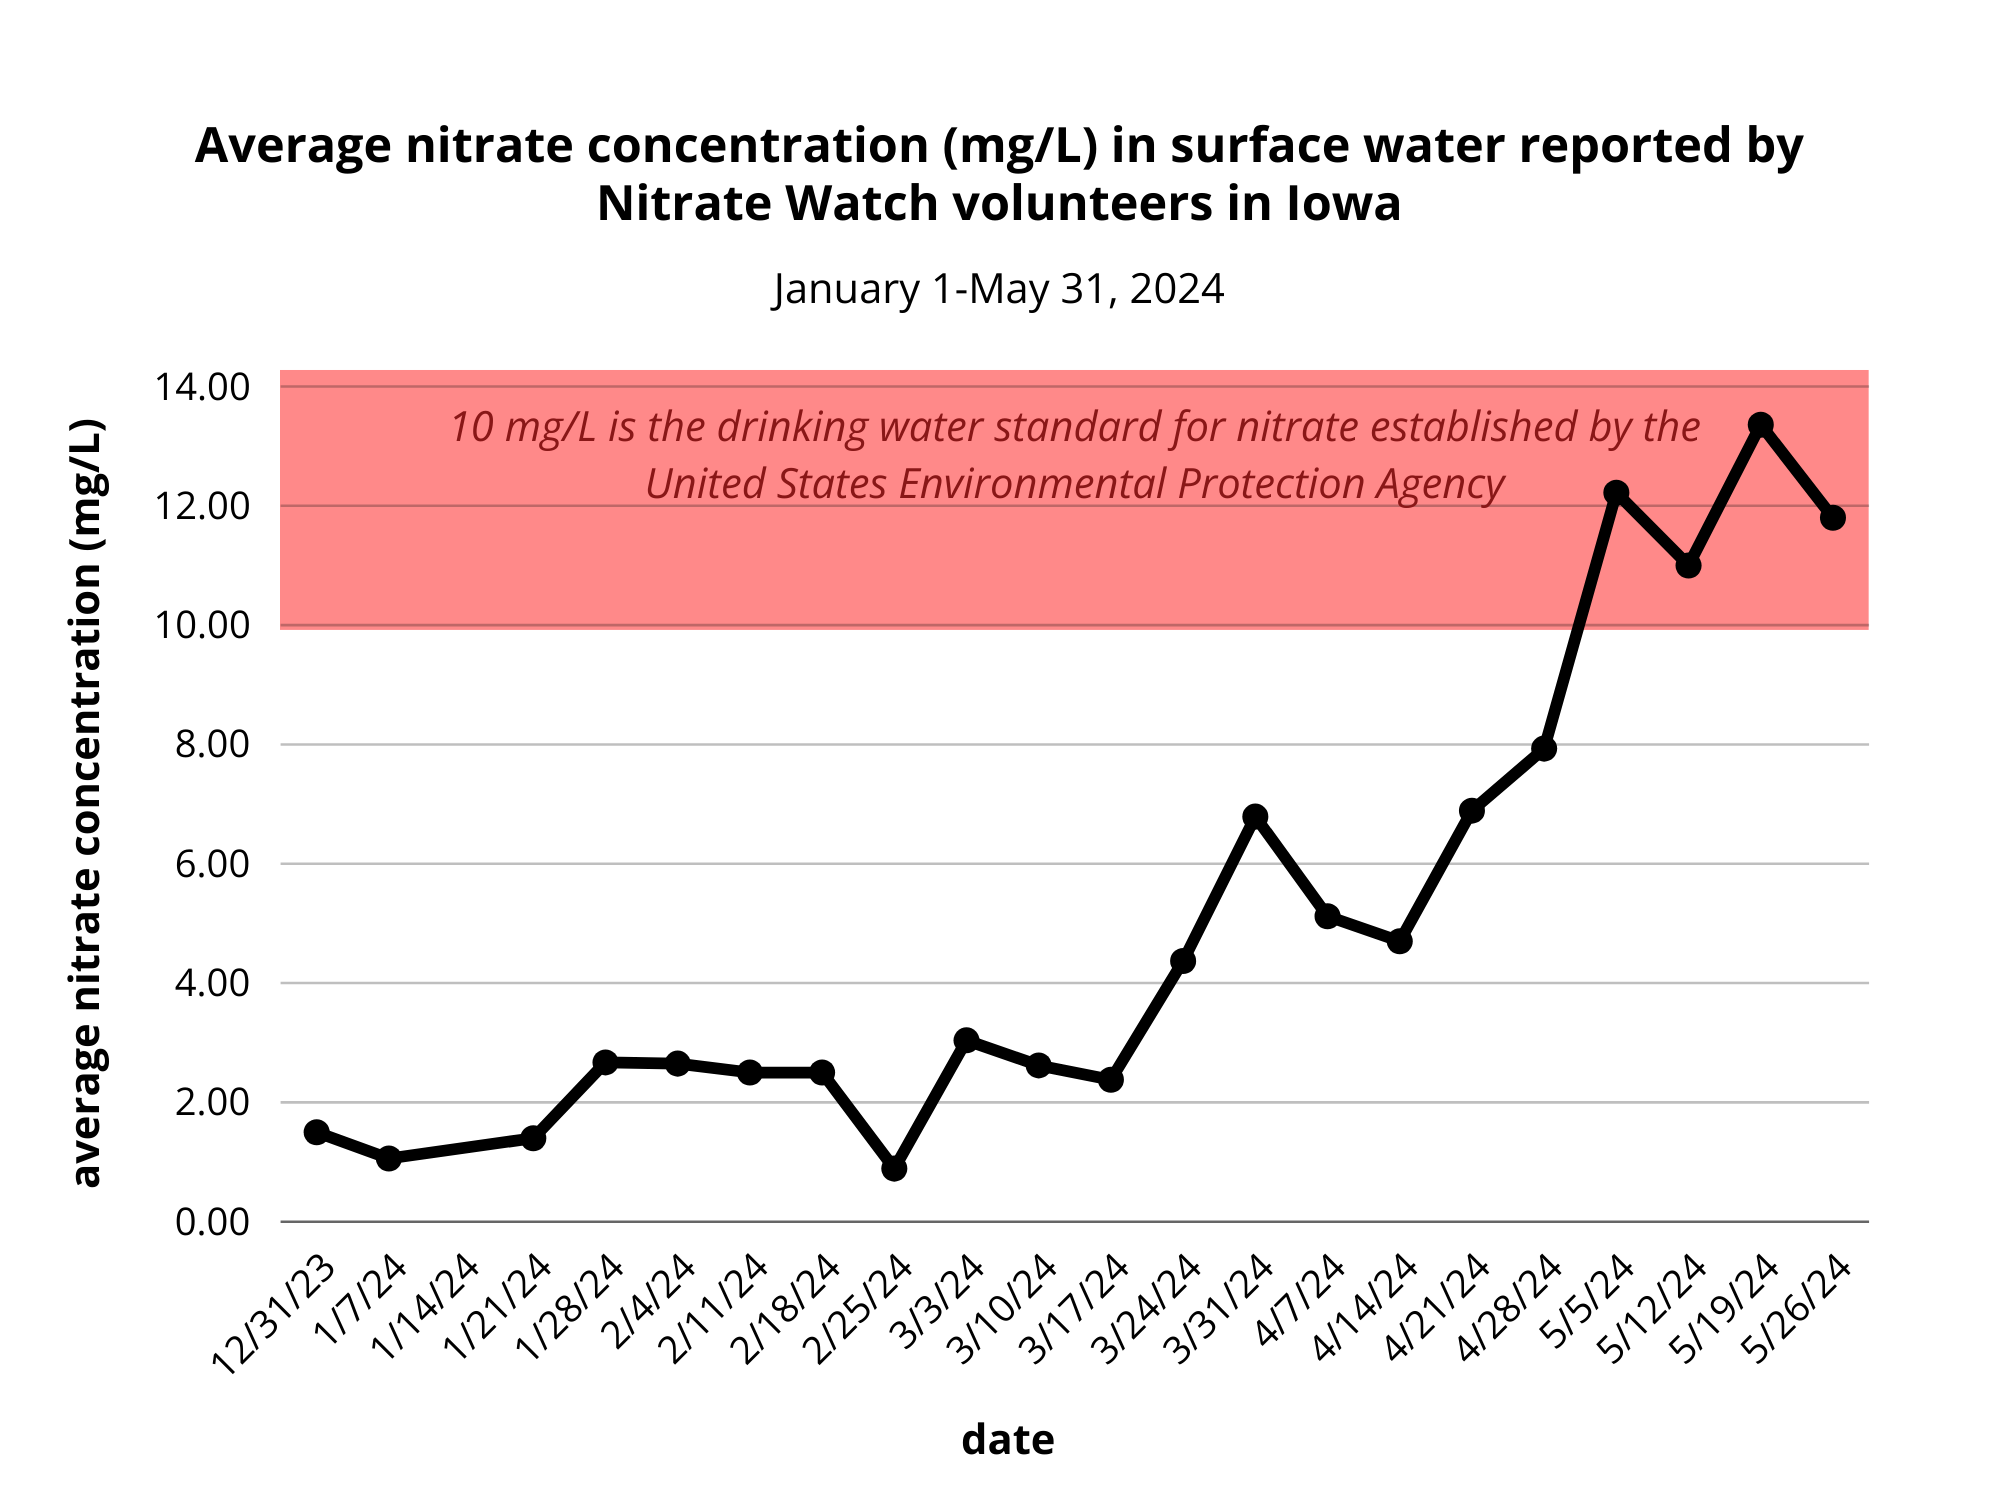
Both analyses depict a steep increase in nitrate concentrations that reach above the 10 mg/L standard established by the United States Environmental Protection Agency. That’s the standard for drinking water; there is no national standard for nitrate
in surface waters.
That’s a problem because approximately 70 percent of America’s drinking water comes from surface water sources. When raw water used as a supply of drinking water contains nitrate in excess of 10 mg/L, it must be mixed with a secondary source
of raw water or treated with expensive nitrate removal technology to deliver drinking water that contains nitrate concentrations beneath the EPA’s standard of 10 mg/L. It would be better to prevent nitrate pollution from getting into source
water in the first place – which is exactly what Nitrate Watch aims to do.
(It is also worth noting that this 10 mg/L standard hasn’t been updated since it was created in 1990, and research suggests that it may not be sufficiently protective of human health. Nitrate Watch, as an advocacy movement, is working on that problem too.)
While these national- and state-level trends tell an eye-opening story, it is important to remember that each waterbody is exposed to unique conditions. To better understand the water quality conditions in your area, explore the Clean Water Hub’s
interactive map of nitrate data and zoom in on sites in your area. The most meaningful way to use Nitrate Watch data is to use local findings to drive local change. Visit the Nitrate Watch What You Can Do page for resources and inspiration about how to share your results and advocate for water quality in your community.
Is your area lacking in local data? You can help! Request your free Nitrate Watch kit and join hundreds of other volunteers who are taking concrete action to document pollution and advocate for water quality in their communities.
