Amid the COVID-19 pandemic, it is no surprise to anyone that in-person Save Our Streams training events slowed to a halt and are now reemerging at a crawl. Clean Water staff, while they miss engaging with volunteers in person, have spent their time analyzing the results gathered from all of the League's community science projects and this analysis yielded some interesting conclusions about water quality! Read on about specific findings in different regions of the country.
Iowa
From 1999-2017, IOWATER was a volunteer water quality monitoring program of the Iowa Department of Natural Resources. Under IOWATER, volunteers monitored thousands of sites and produced tens of thousands of chemical monitoring results all over the state.
Consistent and sustained monitoring is crucial to identify trends in data, establish a normal baseline and detect water pollution problems when they arise. Since IOWATER was defunded in 2016, the Izaak Walton League’s Save Our Streams program is stepping up to create a new statewide volunteer water quality monitoring program in Iowa that will continue the IOWATER legacy.
Nitrate levels were problematic in many parts of Iowa throughout the 18 years of the IOWATER program – and in the final five years of the data (2013-2018), the situation worsened.
One of the parameters measured by IOWATER volunteers was nitrate. Nitrate occurs naturally in low concentrations, but excessive nitrate in water can cause environmental and human health risks, such as cancer and blue baby syndrome (a condition where the baby’s skin turns blue due to lack of oxygen). Big contributors of nitrates in the water can be nitrogen-based fertilizer, faulty septic systems and animal feedlots.
The map above shows the watersheds in Iowa. A watershed is the land area that drains into a specific stream or other waterbody. Darker red watersheds were found to have more nitrate. From this map, we can see that nitrate levels were problematic in many parts of Iowa throughout the 18 years of the IOWATER program – and in the final five years of the data (2013-2018), the situation worsened.
Now, more than ever, we need Iowans collecting water quality data. The termination of the IOWATER program means that fewer volunteers are collecting this valuable data today, even as the nitrate problem is worsening. League staff are working quickly to expand Save Our Streams in Iowa, provide access to training and equipment and gather monitoring results in the Clean Water Hub. This will ensure that there is future data to analyze and the public will have access to the water quality information in their communities.
Check out the interactive maps for Iowa.
Virginia
Many factors can affect stream health including, but not limited to: acute pollution events like oil spills or active construction, chronic fertilizer runoff, climate change and development. By observing how health changes or remains steady over time, we can start looking for local, regional and statewide patterns.
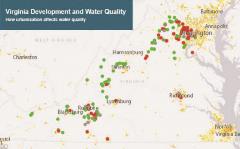
The data collected by Virginia Save Our Streams (VASOS) volunteers shows, without a doubt, that urbanization and development have had a significant impact on the health of streams in Virginia. Impervious surfaces like roads and roofs drive tremendous amounts of polluted runoff into roadside gutters, storm drains, streams and rivers. This water runs untreated into critical sources of drinking water like the Potomac River and reservoirs. Although this water will be treated before it enters people’s homes, some chemical pollutants are difficult – or impossible – to remove.
 Click for larger version.
The map of Virginia, on right, shows 2019's stream health scores. The colored dots mark stream monitoring sites, with each color representing a stream health score: Unacceptable (red), Acceptable (green), and Grayzone (gray). From this map, we can see that streams in rural areas tend to be healthy, while streams in urban areas often struggle with poor water quality.
It is clear from this map that there are swaths of Virginia that are not monitored at all by VASOS volunteers, and the League is doubling its efforts to expand training and fill data gaps in Virginia.
Check out the interactive maps for Virginia.
What's Next?
As we move into a new year, one thing is clear – this analysis provides valuable insights for our monitors and policy objectives and creates media attention and interest on social media that helps us recruit more monitors for the future. However, for us to do sound data analysis, we rely on you (our faithful volunteers) to continue to submit data! You can participate in data collection, from Salt Watch to full-blown biological monitoring with Save Our Streams. Questions? Email the Clean Water Program staff at sos@iwla.org.